Posts

60 Minute Math Block Planning

Image
Recently I wrote a post about planning an 90-minute middle school block . Since then, I've been asked to think about ideas for teaching a 60-minute block in elementary school. I came up with 5 ideas for ways to structure 60-minutes of time with 1st-5th grade students. Think of these as recipes. A starting point. Something you can try as is, and then, as you get more comfortable, move around and adapt to your needs and the needs of your students. I don't know if you like to cook, but it is one of my favorite hobbies. I love trying new recipes. For me, I try the recipe as suggested for the first few times. Once I get comfortable, I might substitute in some herbs. Maybe I change out other ingredients or move things around. It's the same idea for these structures! Option 1: This first idea is based on the 5 E's model : Engage, Explore, Explain, Elaborate, Evaluate. I love this model for encouraging exploration and being true to the constructivist philosophy...
Desmos in Elementary!

Image
If you are an elementary teacher, the tool Desmos Activity Builder might be new to you. While I see most current activities for middle and high school, don't let this deter you from giving it a try! There are some interesting and powerful ways to leverage this digital activity builder for you classroom. I've started making a few activities myself! Some of the best things about Desmos is that you can use it on any device, it's free, the teacher dashboard/controls are awesome, and the activities you can build let you see student thinking in the moment! (Check out my blog post about 9 criteria to see how I judge formative assessment tech tools .) I made a few screencast videos to help you get started and get some ideas of how you might use this in your K-5 classroom: Getting started and adding card sorts to your activity options: Adding a card sort to your activity: Teacher Dashboard and Controls: The power of sketch and sketch overlay:

Criteria for Choosing Tech Tools

Image
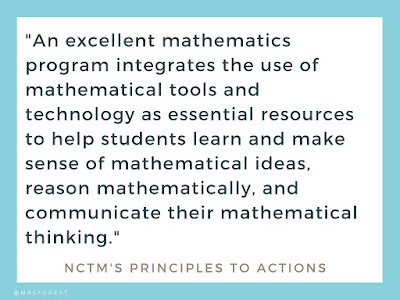
I LOVE USING TECH TOOLS. Let me be clear that I don't like using tech just for tech's sake. Instruction first. Always. Also, focus on the learning. I heard someone say "there is no app for good pedagogy." So true. So, with all those disclaimers, why do I love using technology? Well, it's important, relevant, and honestly can redefine your classroom and the learning for students. I love this quote from NCTM's Principles to Actions : The word essential really stands out to me in this quote. Technology isn't something you can ignore or deny. It's an essential part of our students' world and we need to embrace that. But we all know that there is amazing tech tools and some not-so-great stuff out there. How can you decide what to use? When it comes to using technology in the math classroom, I find using it for students to do practice/formative assessment is most powerful. If I can see their thinking, in the moment, and give feedback it ca...

Back to School: What to Change? What to Keep?

Image
IT'S HERE!!! If you are like me, you feel a little sad about the end of summer but also super excited for a new school year. I love the new school supplies, fresh start, classroom decorating , meeting new kids, and a chance to try new things! I wanted to put together a post that compiled all of my favorite past posts related to stuff teachers think about at the start of a new school year. First, I like to sit down and write out my goals . I think about what I want to keep and what I might want to change . There are several things that you might have done in the past that you might want to rethink. For example, grading , getting rid of your teacher desk , or even how you speak about gender in your classroom . How are you going to arrange your classroom? How will you make seating charts that encourage collaboration ? Think about small changes you could make that will have a big impact. Here are a few . Think about how you might want to treat mistakes in your clas...

First Day of School: "Me In Numbers"

Image
One way to introduce yourself to a new group of students is to do "Me In Numbers."* Here's how it works:  1. Make up a few questions about yourself. List the numbers (out of order) at the bottom. Have some easy to figure out and others that could be several of the options. For example, my daughter is probably not 38 or 1884 years old... but she could be 2, 3, or 14.  2. Display to the class and have them right down their guesses for each statement. Each number at the bottom is used once. (sometimes I like to set it up that they are going to have a "quiz" on this first day. I have a smile on my face so they don't get too nervous, and then obviously when I show them they questions they know it's not a graded quiz but just for fun). 3. Go over the answers as they "grade" their work. As you go over the answers, share a bit about yourself. I usually have a slide or two to go with each answer with some pictures of my family, cats...

Kaleidocycles: How To

Image
via GIPHY I started teaching in 2004. That first year, I found a blank net of a "Kaleidocycle" online. Back then, there weren't as many online tutorials! In fact, this one didn't even come with any instructions. So, I sat down with a few copies and started cutting and gluing until I figured it out. I tried it with my 8th grade students and it was a hit! The next year I tried it again with more middle schoolers and, again, everyone loved it. I continued to use it as one of my go-to end-of-the-school-year lessons . So, in total, I believe I have taught over 1000 students how to make Kaleidocycles ! This copy of a copy is the only lesson that I have saved from that first year of teaching and that I have used consistently, every year, since I first started. It really does hold a special place in my teacher heart. So... how do you make it?! First, download the net . I suggest printing it on card stock. I made a little tutorial video to help you get started. ...

Responsible Data

Image
I think data is important. I even recently presented about " Data Driven Coachin g" at ISTE! I've been thinking a lot about how we use data to tell a story and the implications it has for teachers and our students. One thing that really gets me upset is when I see data being reported (usually visually) in misleading ways. Sometimes I think people just don't realize that they are creating something misleading, while other times things are done to intentionally exaggerate what is actually going on. This TED-Ed video explains this really well: So when I came across this tweet, I immediately looked at the y-axis. I noticed that the % was "zoomed in" making it look like engagement in high school was practically 0%, even though it was 44%. Now, 44% isn't great. And the overall trend of declining engagement is worrisome. But, the math teacher in me was just a little annoyed at the misleading graph. This is OUR problem. We must do something to combat...